
Note:
Please refer to Schroder et al.,2012,PNAS USA for more detailed experimental methods.
RNA Source
Human monocyte-derived macrophages (HMDM) were generated from purified CD14+ monocytes by differentiating for 7 days in the presence of the macrophage growth factor, Colony Stimulating Factor 1 (CSF-1). Mouse bone marrow derived macrophages (BMM) were differentiated from bone marrow for 7 days in CSF-1, and mouse thioglycolate elicited macrophages (TEPM) were harvested by PBS lavage 5 days after intraperitoneal injection of thioglycollate broth. HMDM, BMM or TEPM were stimulated with lipopolysaccharide (LPS, Salmonella minnesota) over 24h, and total RNA was prepared from samples taken at 0, 2, 6 and 24h.
Microarray Design and Analysis
We identified LPS-regulated genes in the macrophage populations of interest (HMDM, BMM, TEPM) using whole-genome microarrays, and then designed human and mouse custom 15K microarrays (Agilent Technologies) targeting LPS-regulated genes identified in any macrophage population, where we could predict human-mouse gene orthology relationships with high confidence (Inparanoid clustering). Probes were designed to interrogate LPS-regulated genes in expanded orthology families (non-1:1) where at every cluster member could be uniquely targeted by at least one probe. 2,505 1:1 orthologs, and 43 non-1:1 orthology clusters (XX human genes, YY mouse genes) were interrogated on the custom microarrays. Multiple probes were designed to target each transcript, or transcript suite where probes could not distinguish between transcripts, expressed at the loci of interest. A total of 5338 mouse and 6685 human transcripts were targeted to cover these loci, with median coverage of 4 probes per transcript. Custom microarrays used in this study are freely available for order from Agilent Technologies (AMAIDs: human 020810, mouse 020809), and the probe sequences are available from the 'Links' tab. RNA from three independent cell preparations (BMM, TEPM) or four independent biological replicas (HMDM, in which each replicate RNA was a pool of RNA from two independent blood donors) was analysed by microarray.
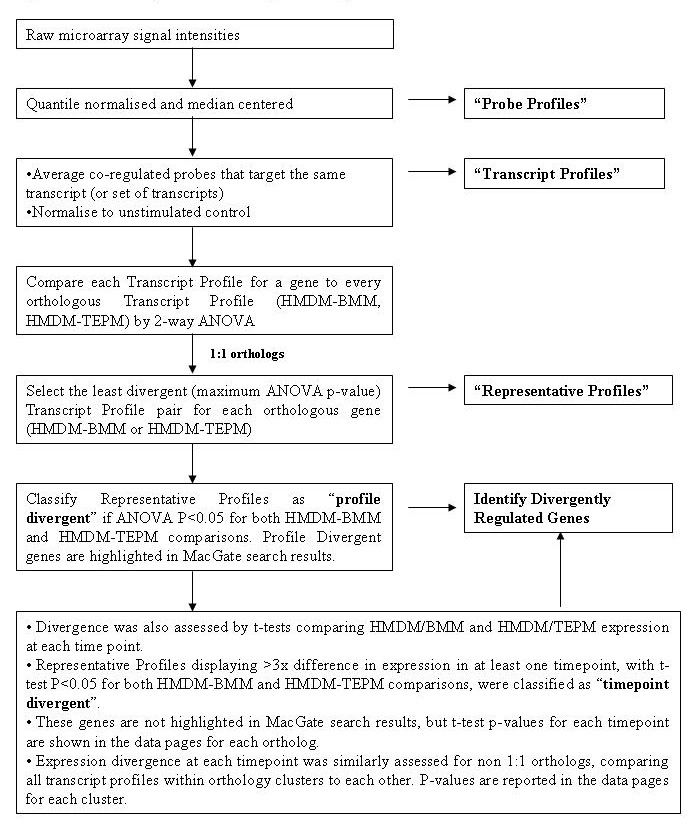
Figure 1 describes the analyses used to identify differentially regulated genes in the human and mouse macrophage populations studied. The processed microarray signal intensities were quantile normalized and median centered to produce Probe Profiles. Since multiple probes were designed to target each transcript/transcript set, probe-level data was averaged to produce Transcript Profiles if probes targeting a transcript/transcript set were co-regulated. For 1:1 orthologs, each LPS-regulated profile was compared to every orthologous profile (HMDM-BMM, HMDM-TEPM) by 2-way ANOVA. Transcript profile pairs with least significant profile divergence between the species were designated Representative Profiles for the orthologous gene pair. Representative profiles were considered to be divergently regulated if the Benjamini-Hochberg-corrected p value for both the HMDM-BMM and HMDM-TEPM analysis reached significance (p < 0.05) for either the (i) 2-way ANOVA assessing significant differences across the LPS profile (profile divergent), or (ii) t-tests assessing profiles with 3-fold or greater differential expression at single time-points (time-point divergent). ANOVA p-values for 1:1 orthologs are displayed in the search results page on this website, and p-values for both ANOVA and individual time-point t-tests can be viewed within the data pages for each ortholog. Expression divergence within non-1:1 orthology clusters was similarly assessed by ANOVA and t-test, by comparing all transcript profiles against each other within each cluster. The resulting p-value matrix is shown on the transcript profile page for each non-1:1 orthology cluster.
The expression data displayed on this website can be downloaded in flat files from the 'Links' tab, and is also accessible via the NCBI GEO repository (GSE19492).
1) Data Retrieval
Gene records in this database are arranged according to orthology groups.
Search for a particular gene using the box at the top of the home page, or just press "Search" to obtain more detailed search options. Expression data can be retrieved by gene name, official gene symbol, gene synonyms, or ENSEMBL ID.
All expression data can be downloaded as flat files from the 'Links' tab.
1.1) Searching the database
Search for a specific gene by gene name or identifier. From the advanced search page, gene search can be restricted to all orthologs, all 1:1 orthologs, all non-1:1 orthologs, or all significantly divergent genes using the drop down box.
1.2) Browsing the database
Leave the search box blank and press enter to return a list of all genes covered on the array, sorted by maximum regulatory divergence (ANOVA p-value). You can browse all 1:1 orthologs, all non-1:1 orthologs, or all significantly divergent genes using the drop down box. Gene lists returned by the browse function are sorted by significance of divergent regulation (ANOVA p-value), with the exception of non-1:1 orthologs, which are sorted by Ensembl Gene ID.
2) Data display
Select the orthology group for the gene of interest from the list of results to access expression data for the genes in that group. (See 'Samples and Analysis' tab for details of expression analysis)
- Gene expression data for 1:1 orthologs is displayed in 3 tabs,
- Representative profile
- Transcript level profiles
- Individual probe profiles
- Gene expression data for non-1:1 orthologs is displayed in 2
tabs
- Transcript level profiles
- Individual probe profiles
2.1) Representative profile tab (1:1 orthologs only)
This tab shows the most similar LPS-regulated Transcript Profile for HMDM and BMM or TEPM (ie the expression profiles associated with the minimum ANOVA p-value for the HMDM-BMM or HMDM TEPM comparison). The data is normalized to the unstimulated control in each cell type to show fold induction.
Links to ENSEMBL and NCBI databases appear in the gene description box, along with the official gene name.
Mousing over the representative profile, or transcript IDs whose expression is measured by this profile, highlights the expression profile in red on the line graph. The Flag column in the representative profile column indicates whether the gene was reliably detected in the macrophage populations studied.
The Species Comparison Statistics Table contains the statistics for HMDM-BMM and HMDM-TEPM profile comparisons, including 2-way ANOVA p-value and p-values for individual time-point t-tests.
Profile Expression data (Mean (SEM)) can be viewed by clicking the link at the bottom of the page.
2.2) Transcript profiles tab
This tab shows all HMDM, BMM and TEPM Transcript Profiles associated with the orthology cluster. Transcript Profiles are calculated from one or more probes targeting the same set of transcripts that show correlated expression profiles. For non-1:1 orthologs, Transcript Profiles for all orthologous genes are displayed. The data is normalized to the unstimulated control in each cell type to show fold induction.
Links to ENSEMBL and NCBI databases appear in the gene description box, along with the official gene name.
Mousing over the profile, transcript or probe IDs highlights the relevant expression profile in red on the line graph.
Transcript Profile Expression data (Mean (SEM)) can be viewed by clicking the link at the bottom of the page. For non-1:1 orthologs, the Species Comparison Statistics table can be viewed by clicking the link. This table contains the statistics for HMDM-BMM and HMDM-TEPM profile comparisons in an all-against-all matrix within the ortholog family, including 2-way ANOVA p-value and p-values for individual time-point t-tests.
2.3) Probe profiles tab
This tab shows all HMDM, BMM and TEPM Probe Profiles associated with the orthology cluster. For non-1:1 orthologs, Probe Profiles for all orthologous genes are displayed. The data is quantile normalized.
Links to ENSEMBL and NCBI databases appear in the gene description box, along with the official gene name.
Mousing over the probe, profile or transcript IDs highlights expression profile for that probe in bold red on the line graph. All other probes that contribute to the same Transcript Profile are highlighted in non-bold red.
Probe Expression data (Mean (SEM)) can be viewed by clicking the link at the bottom of the page.
The MacGate team recommends the following links:
Agilent TechnologiesAgilent works in close collaboration with engineers, scientists, and researchers around the globe to meet the communications, electronics, life sciences, and chemical analysis challenges of today and tomorrow.
Inparanoid
The Inparanoid program was developed at the Center for Genomics and Bioinformatics to address the need to identify orthologs.
Gene Expression Omnibus
GEO is a public functional genomics data repository supporting MIAME-compliant data submissions. Array and sequence-based data are accepted.
